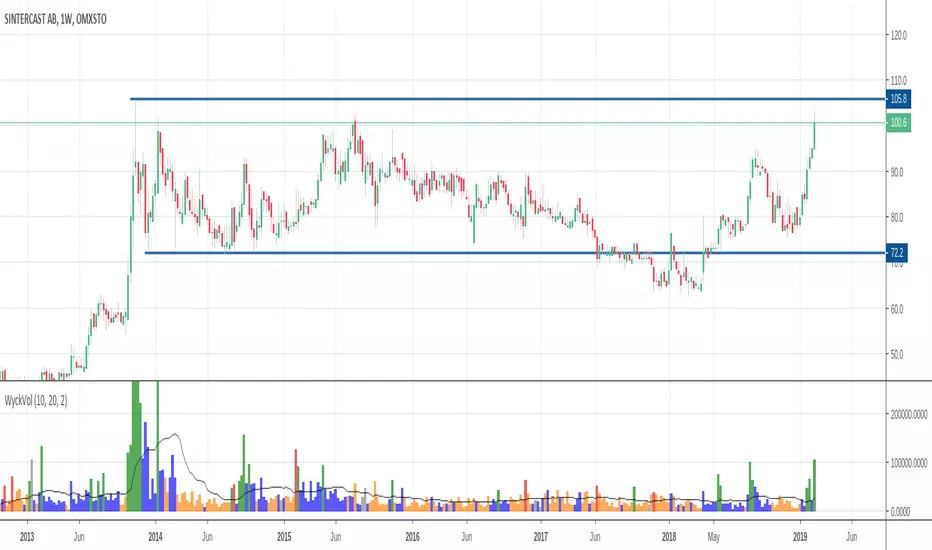
Climatic Volume indicator Buy/Sell ENGLISH
this indicator is contrarian and it's use in my strategy
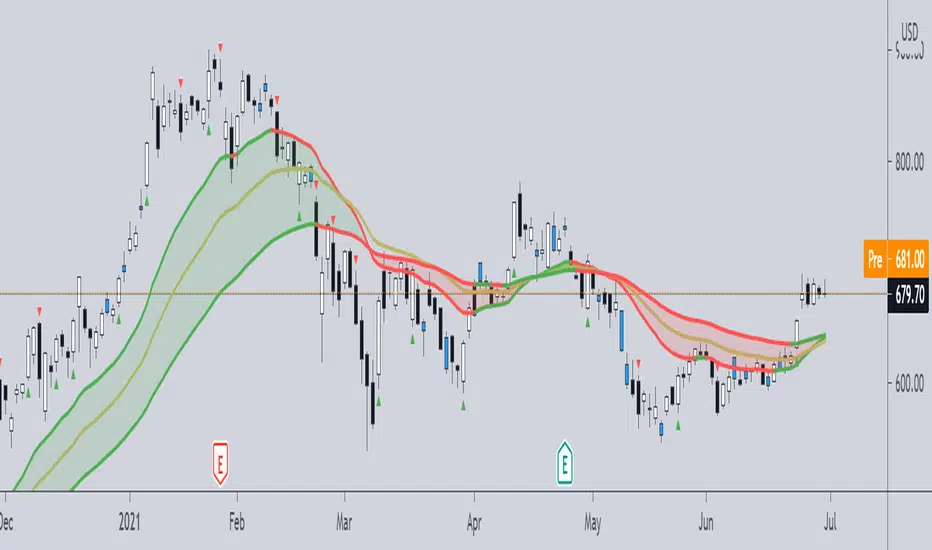
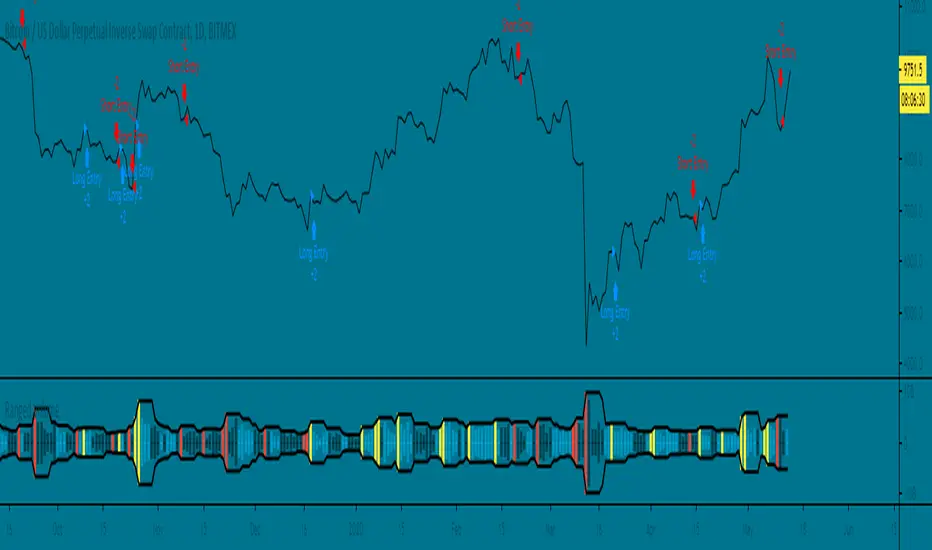
Strategy: when price falls the graph show as two moments with panic during the downtrend: two candlesticks of panic
Both candlesticks are associating with two Volume climatic bars (when volumen double the average volume of last 10 bars). In that moment the institutions buy (remember, the institutions only buy during panic and sell in the euphoria moment because they generate a new trend in the market)
Buy Signal: Bear candlestick with climatic volume in downtrend (first institutions buying) + a few candlesticks more with low volume (lower than average volume of last 10 bars) + second candlestick climatic volume in downtrend (last institutions buying before the new trend)
Moving Stop Loss to break even or first sell of us: bull candlestick with climatic volume associated in uptrend (first take profit of institutions)
Sell Signal: Second bull candlestick with climatic volume associated in uptrend (in this moment the institutions take profit in the timeframe where we are operating and wait for a future new swing)
ESPAÑOL
El indicador es un indicador contratendencial
Estrategia: Cuando el precio cae el grafico nos muestra dos momentos de pánico durante la tendencia bajista: dos velas japonesas de panic
ambas velas japonesas están asociadas a dos barras de volumen climático (un volumen que supera en un 100% el volumen promedio de las ultimas 10 barras). En ese momento las instituciones compran (recuerden que las instituciones compran durante el pánico y venden durante la euforia porque ellos generan una nueva tendencia en el mercado)
Señal de compra: vela japonesa bajista con un volumen climático asociado en una tendencia bajista (primera compra de instituciones) + algunas velas japonesas con bajo volumen + una segunda vela japonesa con volumen climático en una tendencia bajista (la ultima compra de institucionales antes de la nueva tendencia)
Mover stop loss a precio de entrada o hacer nuestra primera venta: vela japonesa alcista con volumen climático asociado en una tendencia alcista (primera toma de ganancias de institucionales)
Señal de venta: Segunda vela japonesa con volumen climático asociado en una alcista (en ese momento las instituciones toman ganancias en el timeframe donde estamos operando y esperan un nuevo swing futuro)
Pine Script® 인디케이터